
Stress Strain Curve Explained | A Beginner’s Guide
The stress strain curve is a vital concept in material science and engineering that helps us understand how materials behave under force. It visualizes the relationship between stress (force per unit area) and strain (deformation), providing insights into material performance. Engineers rely on this curve to ensure safety and functionality in designing structures, selecting materials, and predicting material failure.
The curve has distinct regions that reveal material properties, such as elasticity, plasticity, and strength. The elastic region shows reversible deformation, governed by Hooke’s law, while the plastic region indicates permanent changes. Concepts like Young’s modulus measure material stiffness, while key points like the yield strength and ultimate tensile strength define performance limits. These details make the stress-strain curve a crucial tool for understanding material durability.
This blog delves into the stress-strain curve’s significance and how to interpret its parameters. It covers essential concepts such as elastic and plastic behavior, toughness, and strain hardening. Additionally, it discusses the differences between ductile and brittle materials, types of stress-strain curves, and real-world applications across industries. By the end, you will have a clear understanding of this foundational tool and its role in engineering and material science.
1. What is the Stress Strain Curve?
The stress strain curve shows the relationship between the stress (force per unit area) and strain (deformation) that a material undergoes when subjected to a load. The stress-strain curve has two primary axes: stress on the vertical axis and strain on the horizontal axis. This curve is essential for understanding material behavior and is a critical tool in engineering design, particularly in the selection of materials for particular applications.
Through the analysis of the stress-strain curve, engineers can predict the material’s performance and determine its suitability for use in various environments, thereby ensuring both safety and functionality. A schematic of a typical stress strain curve for low-carbon steel is shown in figure 1.
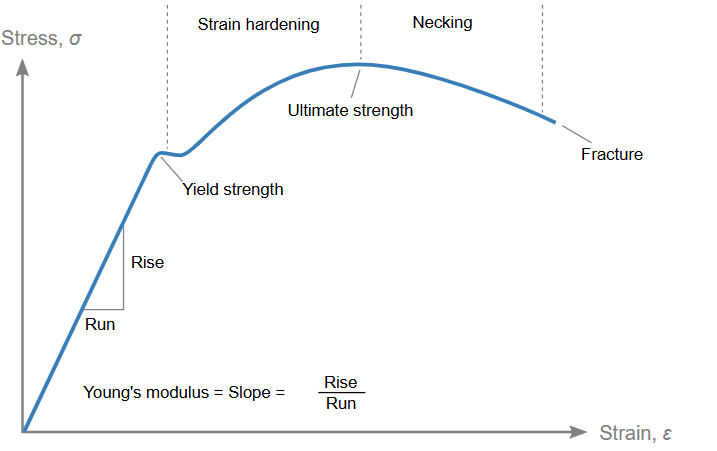
Figure 1: Stress-strain curve for low-carbon steel [Ref]
2. How to Read or Interpret the Stress Strain Curve?
The stress-strain curve provides a wealth of information about a material’s properties. By examining the shape and characteristics of the curve, engineers can infer various material properties, including strength, elasticity, ductility, and toughness. Here’s a clear and simple guide to help you interpret it like an engineer; don’t worry! We will explain each part completely in the following:
 Step-by-Step Guide to Reading a Stress-Strain Curve
| Step | What to Look For | What It Tells You |
|---|---|---|
| 1. Understand the Axes | X-axis: Strain (deformation) Y-axis: Stress (force per area) | Shows how the material deforms as force increases |
| 2. Identify the Elastic Region | Straight, initial portion of the curve | Material returns to original shape when load is removed (Hooke’s Law applies) |
| 3. Spot the Yield Point | The point where the curve starts to bend | Material begins permanent deformation (plastic behavior starts) |
| 4. Explore the Plastic Region | Curve flattens or rises slowly after yield | Material deforms permanently; strength may still increase (strain hardening) |
| 5. Look for Ultimate Tensile Strength (UTS) | Peak point on the curve | Maximum stress the material can handle before necking starts |
| 6. Note the Necking Region | Curve may dip after UTS | Material thins locally and heads toward failure |
| 7. Mark the Fracture Point | End of the curve | Material breaks here; no more load-bearing ability |
| 8. Estimate Material Stiffness | Slope in the elastic region = Young’s Modulus | Steeper slope = stiffer material |
| 9. Check Material Toughness | Total area under the curve | Indicates how much energy the material can absorb before breaking |
| 10. Consider Ductility | Length of plastic region (how far curve stretches before fracture) | Long plastic region = high ductility (can deform more before breaking) |
- Understanding the Axes: Stress and Strain
Stress and strain are two key concepts that describe how materials behave under force.
- Stress refers to the force applied per unit area of the material, usually measured in Pascals (Pa). It represents how much force is exerted on the material area.
- Strain is the measure of deformation that occurs when the material is subjected to stress. It is a dimensionless quantity that indicates how much material has changed in shape or size compared to those before applying force.
The mathematical relationship between stress and strain can be articulated through various terms, which depend on the object’s geometry, the external environment, and the characteristics and orientation of the forces exerted upon it (see Figure 2).
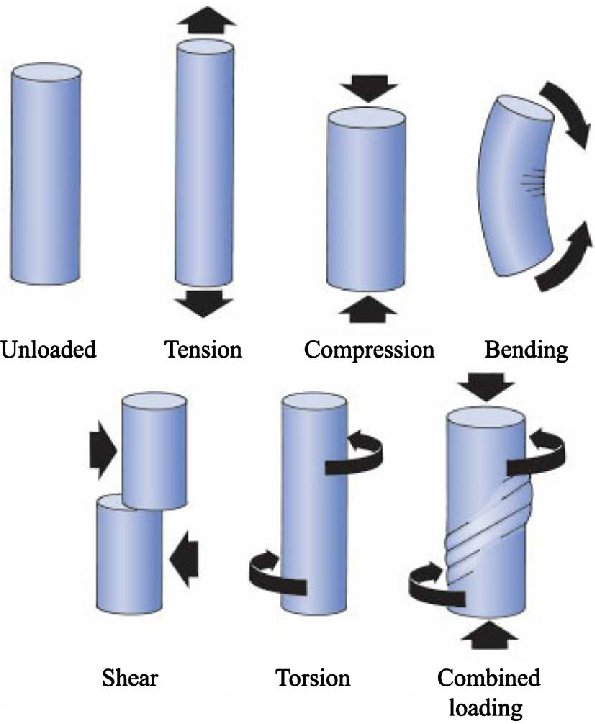
Figure 2: Schematic illustration of different loading cases [Ref]
 Bonus Tips for Interpreting the Curve
-
Use the 0.2% Offset Method if the yield point is unclear—this is standard for metals with gradual transitions.
-
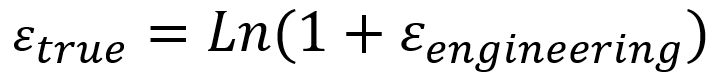
True vs. Engineering Curve: Use true stress-strain for large deformations like in metal forming.
-
Material Type Matters: Ductile = long, curvy graph; Brittle = short, steep graph with sudden drop.
-
Conditions Change the Curve: High temperature or loading speed affects shape and behavior.
3. What are the key regions of the stress strain curve?
There are several key regions on the stress-strain curve that are important for understanding material behavior:
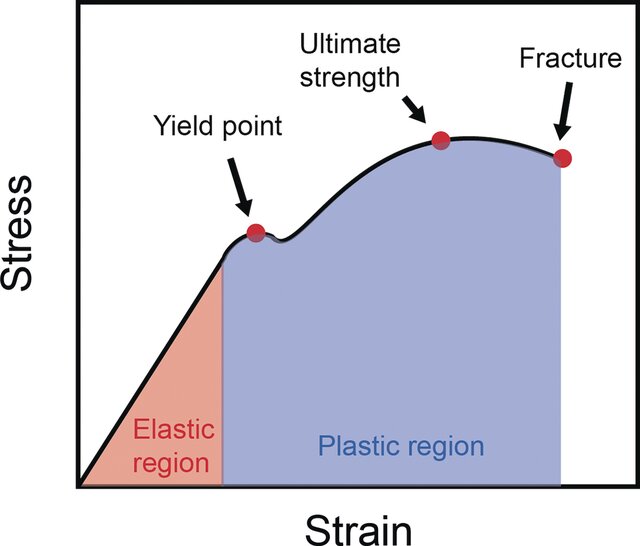
Figure 3: Regions of stress-strain curve [Ref]
- Elastic Region: In this region, the material deforms but returns to its original shape once the stress is removed. The relationship between stress and strain is linear here (See figure 3).
- Plastic Region: This region indicates that the material is permanently deformed. The material can still undergo strain, but it won’t return to its original form once the load is removed (See figure 3).
- Yield Point: The point at which the material transitions from elastic deformation to plastic deformation. After this point, the material will not return to its original shape, and permanent deformation occurs. It marks the threshold at which permanent deformation begins, and understanding this value is crucial for ensuring that materials do not deform beyond acceptable limits in engineering designs (See figure 3).
- Necking: Necking occurs when the material has reached its ultimate tensile strength, at which point strain hardening is no longer feasible. This results in localized deformation within a specific area of the material’s cross-section, leading to a reduction in dimensions while the stress continues to rise (See figure 1).
- Ultimate Tensile Strength: The ultimate tensile strength (UTS) is the maximum stress that a material can withstand before breaking. It is an important factor in selecting materials for load-bearing applications, as it determines the maximum load a material can handle without fracturing (See figure 3).
- Fracture Point: The point at which the material breaks or fractures, usually after significant plastic deformation (See figure 3).
4. How Stiff is It? Decoding the Slope of the Stress-Strain Curve | Elastic Region in stress strain curve
The stress strain curve allows us to see the stages of material deformation. It shows the material’s initial elastic behavior which is the elastic region in stress strain curve (where it returns to its original shape after the stress is removed), followed by plastic deformation which is the plastic region in stress strain curve (where the material permanently deforms), and finally fracture (where the material fails) as illustrated in figure 3. This curve is essential for understanding how materials behave under stress, which directly impacts engineering decisions.
Understanding the slope of the stress-strain curve—especially in the elastic region—gives valuable insight into a material’s stiffness and how it behaves under stress. Here’s a simplified breakdown:
![]() Summary of Key Elastic Properties and Their Relation to the Curve
Summary of Key Elastic Properties and Their Relation to the Curve![]()
| Property | What It Means | Where It Appears on the Curve | Why It Matters |
|---|---|---|---|
| Hooke’s Law | Stress is directly proportional to strain in the elastic region | Linear (straight-line) part at the beginning of the curve | Shows the material will return to original shape when stress is removed |
| Young’s Modulus (E) | Measures stiffness = how much a material resists being stretched | Slope of the elastic region (steeper slope = stiffer material) | Key design value to choose the right material for structural applications |
| Shear Modulus (G) | Material’s resistance to shape change under shear stress | Not shown on a normal stress-strain curve (needs shear tests) | Important in applications involving torsion or sliding forces |
| Bulk Modulus (K) | Resistance to volume change under uniform pressure | Not visible on standard uniaxial stress-strain curves | Useful for materials under pressure (e.g., fluid-filled systems or confined solids) |
| Poisson’s Ratio (ν) | Ratio of lateral (sideways) contraction to axial (lengthwise) extension | Not directly visible on the curve, but relates to shape change during elastic deformation | Helps predict multi-directional deformation; crucial in 3D stress analysis |
Key Takeaway
-
Elastic region = slope = stiffness info
-
Only Young’s Modulus is directly seen in the normal stress-strain curve
-
Other moduli (shear, bulk) require specific test conditions
-
Knowing these values helps engineers design materials that stay strong, stiff, or flexible—just the way they need to.
Hooke’s law:
Hooke’s law states that the stress applied to a material is directly proportional to the strain it produces, as long as the material remains within its elastic limit. It is worth mentioning that, on the stress strain curve, Hooke’s law is valid in the elastic region. Here, the stress-strain relationship is linear, and the material will return to its original shape when the stress is removed. Young’s modulus, shear modulus, bulk modulus, and other related measures are all derived from the principles of generalized Hooke’s law .
Hooke’s law can be shown mathematically. The consistent ratio of stress to strain in this domain is identified as Young’s modulus, E, (SI unit: Pa), which is also recognized as stiffness.
In the above equation, ![]() is stress and
is stress and ![]() is strain.
is strain.
Young’s modulus:
Young’s modulus is a fundamental property of materials that remains constant regardless of their geometry, being uniform for a given material. Materials that exhibit structural anisotropy may demonstrate varying Young’s moduli depending on the direction of measurement. For instance, wood displays higher Young’s moduli when tested along the grain compared to when it is tested perpendicular to the grain.
Shear modulus:
In addition, we can define the shear modulus, also known as the rigidity modulus, G, as follows:
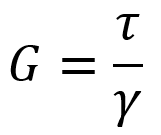
Wherein, ![]() is shear stress and
is shear stress and ![]() is shear strain.
is shear strain.
Thus far, we have examined Young’s modulus in the context of uniaxial tension and the shear modulus concerning forces that are coplanar with the cross-section of a material.
Shear modulus is not directly seen in the normal tensile/compressive stress-strain curve.
It is instead measured using a shear stress-strain curve in experiments involving torsion or direct shear loading.
Bulk modulus:
Another important elastic constant is the bulk modulus, which describes the material’s response to volume changes. It is defined as the ratio of hydrostatic stress to relative volumetric strain:
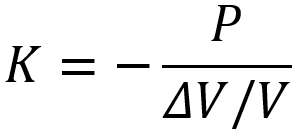
Where P is applied pressure and ![]() is the volumetric strain, which is calculated as the change in volume divided by the original volume.
is the volumetric strain, which is calculated as the change in volume divided by the original volume.
Bulk modulus is not directly related to the uniaxial stress-strain curve. It is instead determined under hydrostatic compression conditions. Bulk Modulus: Requires hydrostatic compression experiments and is not visible in a typical stress-strain curve.
Poisson’s ratio:
Poisson’s ratio is a fundamental material property that describes how a material deforms in directions perpendicular to an applied force. When a material is stretched in one direction, it typically contracts in the other two perpendicular directions. Poisson’s ratio quantifies this behavior.
Mathematically, Poisson’s ratio (ν) is defined as the negative ratio of lateral strain to axial strain:
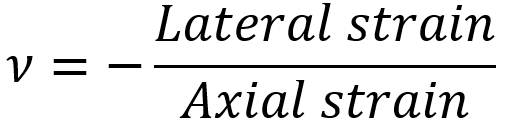
This ratio helps engineers predict how materials will behave under stress, particularly in terms of shape change. For instance, if a material is pulled in tension along its length, its diameter will decrease —Poisson’s ratio tells us by how much.
The typical Poisson’s ratio for metals is around 0.3, meaning that when stretched, the material’s lateral contraction is about 30% of the axial elongation. Materials with a Poisson’s ratio of 0.5 are considered incompressible, as their volume remains nearly constant under deformation.
This property is crucial in fields like material science, structural engineering, and biomechanics, as it influences everything from design to the performance of materials under various load conditions.
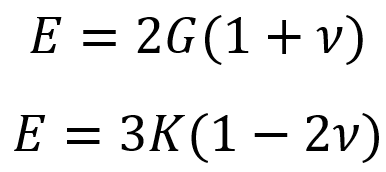
For isotropic materials, a connection exists between Young’s modulus, shear modulus, and bulk modulus through Poisson’s ratio (ν).
5. Determining Yield Strength: The 0.2% Offset Method Explained
The 0.2% offset method is a way to determine the yield strength of materials that do not have a clearly defined yield point (e.g., many metals and alloys).
In some materials, the transition from elastic to plastic deformation is gradual, so it is difficult to pinpoint the exact point where plastic deformation begins. As shown in figure 4, a line is drawn parallel to the initial linear (elastic) portion of the stress-strain curve, starting at a strain value of 0.2% (0.002 in decimal form). The point where this offset line intersects the stress-strain curve is taken as the yield strength.
In simple terms:
-
Yield point is the location where yielding starts.
-
Yield strength is the value of stress at that point.
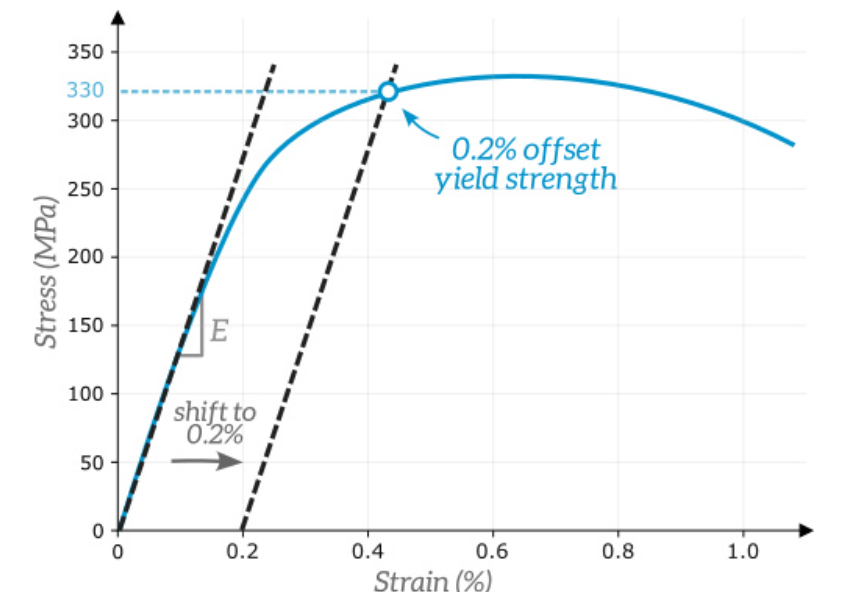
Figure 4: Determining the yield strength of a material using the 0.2% offset method [Ref]
Step-by-Step: How to Apply the 0.2% Offset Method
| Step | What to Do | What It Means |
|---|---|---|
| 1. Plot the Stress-Strain Curve | Start with data from a tensile test and draw your curve. | This curve shows how the material responds to load. |
| 2. Identify the Linear (Elastic) Region | Look for the initial straight-line portion of the curve. | This is where the material behaves elastically (Hooke’s Law applies). |
| 3. Draw the Original Slope Line | Extend the elastic region line slightly forward. | This shows how the material responds before any permanent deformation. |
| 4. Offset the Strain Axis by 0.2% | From the x-axis (strain), move 0.002 units (or 0.2%) to the right. | This represents a small, standard amount of permanent strain. |
| 5. Draw a Parallel Line | From that offset point, draw a line parallel to the elastic slope. | This is your offset line—it mimics the material’s elastic response, starting 0.2% later. |
| 6. Mark the Intersection | Find where your offset line crosses the curve. | This point is your yield strength—the stress at which the material starts to deform permanently. |
| 7. Read the Stress Value | Move horizontally from the intersection to the y-axis (stress). | This value is the yield strength, usually in MPa or psi. |
Quick Notes:
-
Why 0.2%? It’s an industry standard—small enough to be practical, big enough to measure.
-
Works for materials with no clear yield point, like aluminum or stainless steel.
-
This method is especially helpful in design, safety calculations, and comparing materials.
6. Engineering VS True Stress Strain Curve
Engineering Stress-Strain Curve Definition:
The stress and strain are calculated based on the initial cross-sectional area and initial length of the specimen.
- Engineering Stress:
Where F is the applied force, and A0 is the initial cross-sectional area.
- Engineering Strain:
Where ![]() is the change in length, and
is the change in length, and ![]() is the initial length.
is the initial length.
True Stress-Strain Curve Definition:
The stress and strain are calculated based on the instantaneous cross-sectional area and instantaneous length of the specimen during deformation. It provides a more accurate representation of material behavior, especially at large strains. It is critical for understanding material behavior during plastic deformation, necking, and forming processes.
- True Stress:
- True Strain:
The summarized key differences between the engineering stress strain curve and the true stress strain curve
| Aspect | Engineering Stress-Strain Curve | True Stress-Strain Curve |
| Stress | Uses initial area (A0) | Uses instantaneous area (Ainstantaneous) |
| Strain | Uses initial length (L0) | Uses instantaneous length; includes logarithmic strain |
| Necking | Does not account for necking; stress decreases after UTS | Accounts for necking; stress continues to rise |
| Curve Shape | Drops after UTS (ultimate tensile strength) | Continues to rise due to reduced cross-sectional area |
| Applications | Approximation for small deformations | Accurate for large deformations |
7. Hardness and Toughness
Toughness is the capacity of a material to absorb energy until it reaches the point of fracture. Materials that can absorb a lot of energy before fracturing are considered to possess high toughness.
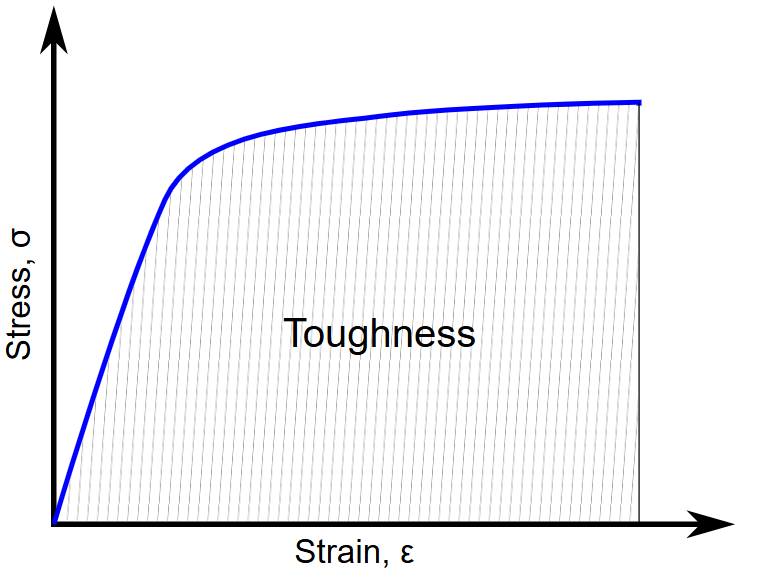
Figure 5: Toughness visualization in stress strain curve [Ref]
Toughness can be visualized as the area under the stress-strain curve, as shown in figure 5. A larger area indicates greater toughness and allows the material to absorb a large amount of energy before fracturing.
To achieve high toughness, a material must have a good balance of both high strength and high ductility, whereas materials that are low in strength and brittle typically demonstrate low toughness.
When we describe a person as resilient, we are indicating their capability to rebound from alterations and maintain their inherent personality. Comparably, the resilience of materials can be characterized as the extent to which they can absorb energy while still being able to revert to their original form. In other words, resilience defines a measure of the ability of a material to absorb energy while deforming elastically (See figure 6).
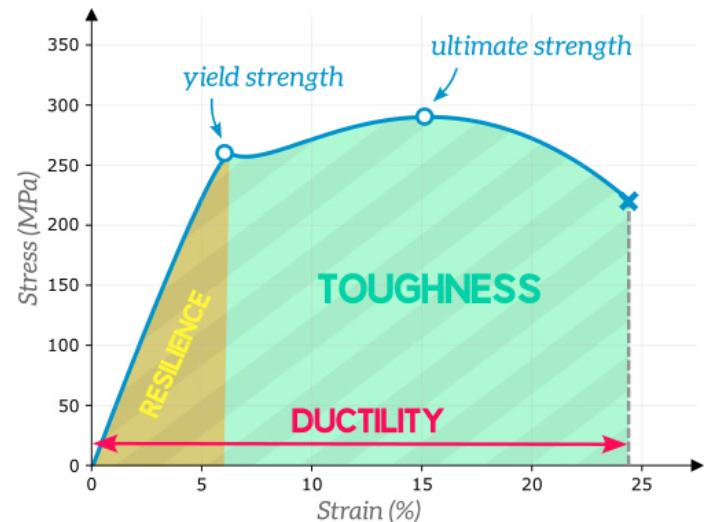
Figure 6: resilience visualization in stress strain curve [Ref]
Toughness is a bulk property, while hardness is a surface property. Hardness is resistance against scratches, abrasion, and erosion, whereas toughness is associated with fracture resistance, compressive strength, and elongation capacity.
8. Strain Hardening and Work Hardening
Work hardening and strain hardening are the same. Strain hardening is one of the most commonly used means of adding strength to an alloy. It is the use of permanent deformation to increase the strength of the metal.
Work hardening, often referred to as strain hardening, is the phenomenon whereby the strength of a material is enhanced as it undergoes plastic (permanent) deformation (See figure 7). It is called cold-working because the plastic deformation must occur at a temperature sufficiently low to prevent the rearrangement of atoms. This property is especially important in metals, which can become more resistant to further deformation after experiencing significant strain. Understanding strain hardening helps engineers design materials that can handle repeated loads.
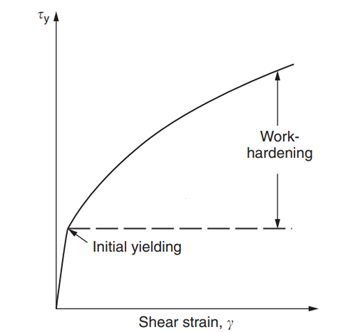
Figure 7: Work hardening in stress strain curve
The summarized key differences in hardness and toughness, and hardening
| Property | Definition | Relation to Stress-Strain Curve | Measurement |
| Toughness | Energy absorbed before fracture | Total area under the stress-strain curve | Integrated area (elastic + plastic) |
| Hardness | Resistance to localized deformation | Not directly on the curve; related to strength (higher yield/UTS → higher hardness) | Indentation tests |
| Hardening | Increase in strength due to plastic deformation | Observed as the upward slope in the plastic region (from yield strength to UTS) | Slope in plastic region |
9. Ductile VS Brittle stress strain curves
- Ductile Materials: For ductile materials such as metals, the stress-strain curve is typically linear in the elastic region, followed by a significant plastic region. This means that the material will deform in a predictable, proportional manner to the applied force. These materials can withstand significant deformation before failure, making them ideal for structures that need to absorb loads without breaking immediately.
- Brittle Materials: In contrast, brittle materials like ceramics exhibit a non-linear stress-strain curve. Brittle materials exhibit little to no plastic deformation before fracture. These materials do not deform much before they fracture, meaning they are less forgiving under stress. They are more likely to fail suddenly without much warning, which makes them unsuitable for applications that require ductility.
The difference between the stress-strain curves of flexible and brittle materials is shown in figure 8.
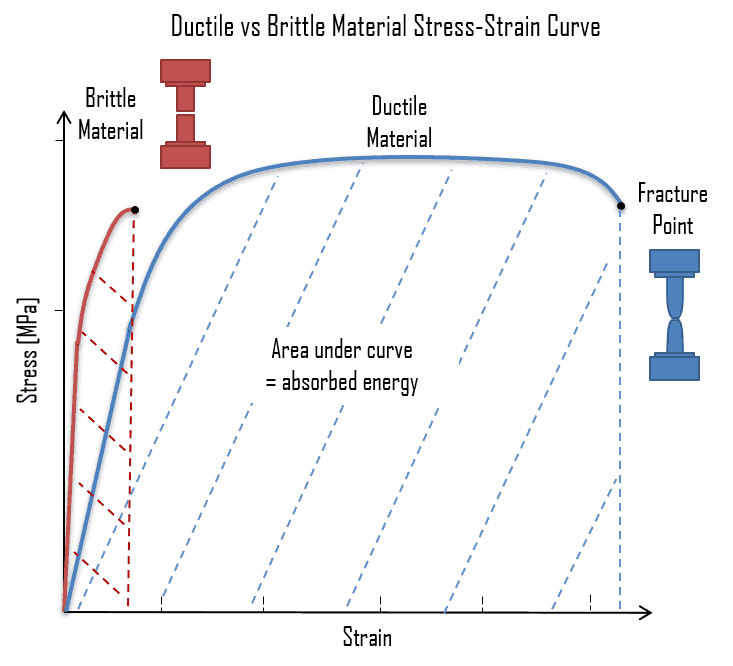
Figure 8: Ductile and brittle material stress strain curve [Ref]
10. Different Materials, Different Curves: Metal, Polymer, and Ceramic
Metals, polymers, and ceramics each exhibit different types of stress-strain curves. Metals typically show a clear elastic region followed by plastic deformation. Polymers, however, may exhibit more complex behavior, often showing a significant amount of elasticity before yielding. Ceramics, being more brittle, tend to have a steep, non-linear curve, with a sharp fracture point (See figure 9).
Figure 10 shows the difference in the toughness of these materials.
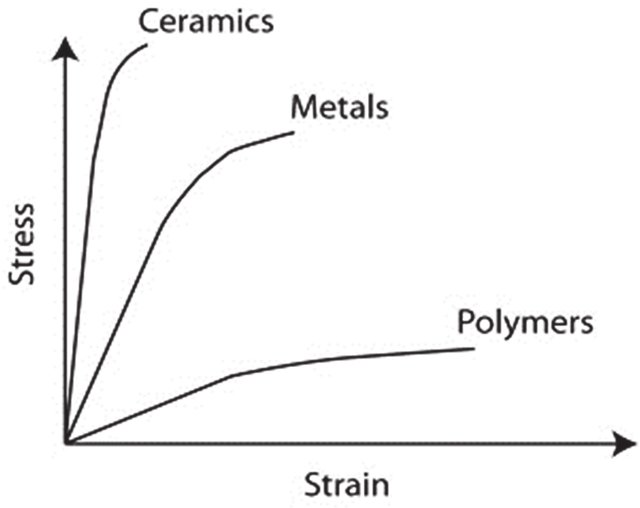
Figure 9: Typical Stress-strain Curve for the three classes of materials [Ref]
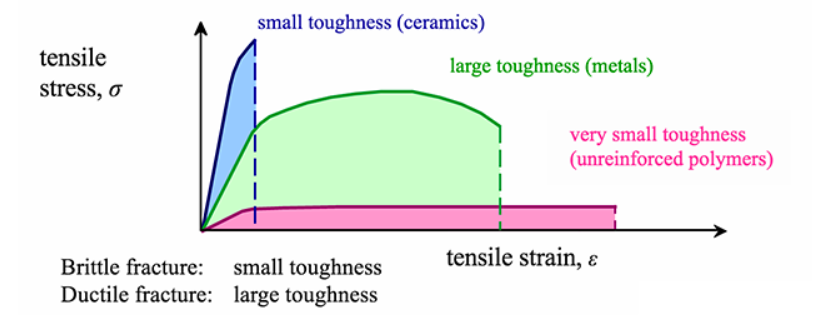
Figure 10: Comparison of toughness for the three classes of materials [Ref]
11. The Role of Temperature and Strain Rate on the Curve
Temperature and strain rate can significantly affect the stress-strain curve. For example, at higher temperatures, metals may become more ductile, while at low temperatures, they may become brittle. Similarly, the rate at which stress is applied can affect how the material behaves, influencing the material’s performance in real-world conditions.
12. How to conduct a stress strain test: A step by step guide
Stress-strain tests are performed to understand how materials behave when subjected to stress. The most common types of stress-strain tests include:
- Tensile Test: This test involves applying a pulling force to a material until it stretches and eventually breaks. It is used to determine the material’s tensile strength, yield strength, and ductility. It is necessary to produce test samples and then use the tensile testing machine as shown in figures 11 and 12.
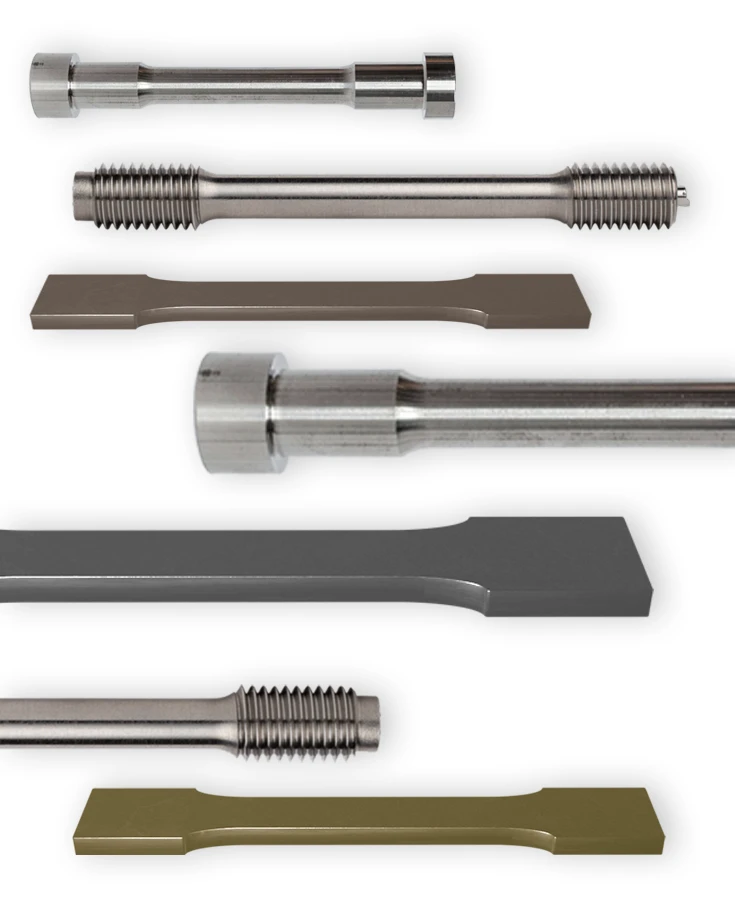
Figure 11: Tensile test sample [Ref]
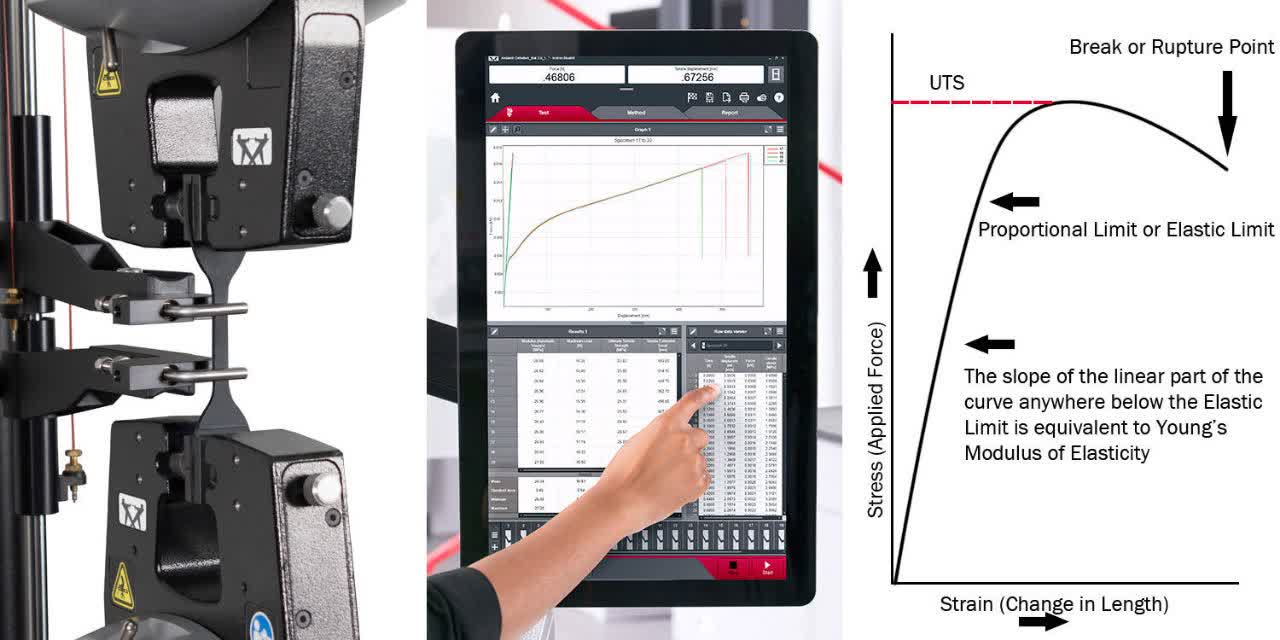
Figure 12: Tensile test device [Ref]
- Compression Test: In this test, the material is compressed by applying force to compress it along its length. It helps determine how a material reacts to compressive forces, useful for materials like concrete.
- Shear Test: Shear tests are performed to measure the material’s response to shear stress, which occurs when forces are applied parallel to the surface of the material.
Setting up Your Test: Equipment Needed
To perform a stress-strain test, the following equipment is typically required:
- Testing Machine: A universal testing machine (UTM) that can apply tensile or compressive forces and measure deformation.
- Extensometer: A device used to measure the deformation or strain on a sample during testing.
- Specimen: A standard sample of the material being tested, usually shaped as a cylindrical or rectangular specimen.
- The setup includes attaching the specimen to the machine grips and ensuring that the alignment is correct to avoid inaccurate readings. Calibration of the testing machine is essential to ensure precise measurements of force and deformation.
Understanding the Data and Plotting the Stress-Strain Curve
Once the test is performed, the data is recorded as force versus displacement, which is then converted to stress versus strain. The result is a stress-strain curve that illustrates the material’s behavior under load. The curve provides insights into the material’s elastic and plastic regions, yield strength, ultimate tensile strength, and failure point.
13. Stress Strain curve: Real world applications and examples
Stress-Strain Curves in Structural Engineering
In structural engineering, the stress-strain curve is used to predict how materials will perform under the forces they experience in real-world structures. The curve helps engineers choose the right materials for different parts of a structure, ensuring they can withstand the necessary loads without failure. For example, the curve would indicate the right type of steel for a bridge or the appropriate concrete mix for a building foundation.
The curve also helps in ensuring that structures have sufficient safety margins. By knowing the ultimate tensile strength and yield strength of materials, engineers can design components that stay well within their limits, avoiding catastrophic failures.
Applications in Aerospace and Automotive Industries
In aerospace, the stress-strain curve is crucial for selecting lightweight yet strong materials capable of withstanding extreme conditions. Aircraft components must endure both high tensile forces and rapid changes in stress, so materials like titanium and aluminum alloys are often chosen based on their favorable stress-strain characteristics.
Similarly, in automotive engineering, understanding the stress-strain curve of materials ensures that car frames and components are both safe and durable under crash conditions. The material must be strong enough to absorb the impact without causing harm to passengers, but also light enough to ensure fuel efficiency.
How the Stress-Strain Curve Impacts Consumer Products
The stress-strain curve isn’t just important for large-scale engineering projects. It’s also a key factor in consumer products like smartphones, furniture, and packaging. Materials used in these products must balance durability with cost-effectiveness. For example, the stress-strain curve helps determine the strength and flexibility of smartphone screens, ensuring they can resist impact without shattering easily.
14. Common Misunderstandings about the Stress-Strain Curve
Why Some Materials Don’t Follow a Simple Stress-Strain Curve
Not all materials exhibit simple, linear stress-strain behavior. Some, like certain polymers or composites, show more complex behavior due to factors such as molecular structure, temperature sensitivity, or loading rates.
These materials may exhibit non-linear stress-strain curves or even unique failure modes that don’t align with the typical expectations of ductile or brittle materials. Figure 13 shows a stress strain curve for a composite material with different percentages of reinforcing filler (Date palm waste (DPW)) in a polypropylene matrix (PP). It can be found that the difference in the reinforcing changes the stress strain curve.
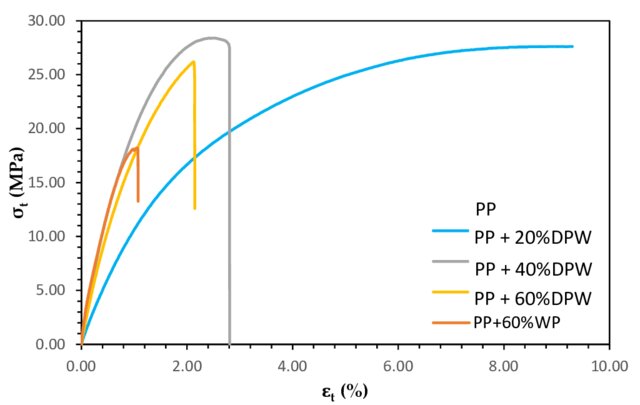
Figure 13: Stress–strain curves of composite materials with different percentages of reinforcing filler [Ref]
Misstatements and Facts: Debunking Common Misconceptions
There are several myths about the stress-strain curve that can lead to misunderstandings. For example, some people assume that a higher ultimate tensile strength always means a better material. However, materials with higher strength may not necessarily be the best for all applications. The complete stress-strain curve, including ductility and toughness, must be considered to ensure the material will perform as needed in the specific application.
15. Conclusion
This article explored the stress strain curve. We discussed key topics, including parameters of stress strain curves and different Types of stress-strain curves related to different material properties. Determining the Yield Strength from a Stress-Strain Curve using the 0.2% offset method is discussed. Types of stress and strain, including engineering vs. true stress-strain curve, were introduced. Through this article, we learned that the stress-strain curve is a fundamental tool in material science and engineering design. By understanding the behavior of materials under stress, engineers can select the right materials, predict material failure, and design safe and functional products. The stress-strain curve plays a critical role in ensuring the success of different engineering projects.