
")
")
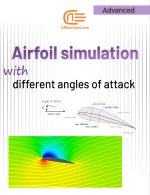
Why airfoils are so important in industry?
One of the most important parts of industrial units are power generation unit. At this unit, other energy types change to mechanical energy. To reach this purpose in most cases the turbine blades which are a kind of airfoils play a crucial role. On the other side in the aviation industry, airfoils also play a vital role. Airfoils are used to make enough lift force to start the flight or adjust the angle of the end of the wings for the appropriate landing process. The most important parameter of airfoils is angle of attack. Some physical phenomenon occurs due to a change of angle of attack. For example, stall in compressors is due to something like angle of attack. So, we understand that the angle of attack is a very crucial parameter in the function of airfoils. In this package, we talk about the effect of changing the angle of attack on lift and drag coefficients and also lift and drag forces.
Can we do our simulations automatically?
The above question’s answer is yes! We can do our simulations automatically. But what does it mean?
It means when you want to change some parameters like inlet velocity or angular speed or geometrical parameters such as the height of something or the angle of rotation of a geometry (like our airfoil) so many times, you can do it automatically by linking Fluent to MATLAB. You give MATLAB the desired inputs, MATLAB imports them to Fluent and runs the simulations automatically and after that, you can export desired outputs like variation of temperature over a line at for example your 100 simulations.
What will we do with Ansys Fluent software?
First, we download the coordinate files of a specific airfoil (NACA 0012) after that we must adjust the coordinate file and split it into upper case and lower case which are the upper arc and the lower arc of the airfoil. Now we import the adjusted coordinate file into Design Modeler and we do some operations to create the airfoil domain and also the fluid domain. At this step, we create the parameter “Angle of Attack”. When we are done with the designing process, it’s time to create an appropriate mesh with acceptable quality. At the designing step, we do something to prevent bad mesh quality. Bad mesh quality occurs when we have sharp edges. We split the fluid domain into the inner domain and outer domain, the inner domain has a finer mesh size because the divergence of our variables is high in this domain. After finishing the meshing process, we will check the mesh quality parameters such as Skewness and Orthogonal Quality. The Orthogonal Quality must be greater than 0.1 and Skewness must be lower than 0.7. after creating the mesh, we started our simulation by starting the Fluent software, we set the general settings and chose the appropriate turbulence model. Now it is time to set the boundary conditions and initial conditions but, our problem is a steady state and we do not have initial conditions. So now we can run our first simulation. After the convergence conditions are reached, we must check the y-plus value on the airfoil wall. The appropriate range of y-plus in our simulation depends on the wall function in some turbulent models like the k-epsilon model. But in some turbulence models in which we don’t have wall functions the appropriate y-plus range is all the numbers under one. If the y-plus is not in the desired range we must go back to the meshing process and change the meshing conditions. After changing the mesh, we do the final simulation and also, we must be sure about the y-plus value so we check the value again. Now we can create the output parameters that are important to us. After that, we can start post-processing by starting the CFD-Post. We can see the velocity contours and also the pressure contours. Also, we can see the streamlines.
Now we must link the Ansys Fluent to MATLAB. We do this process by recording journal file. When the journal file is created, we change the journal file to make it applicable.
What will we do in MATLAB?
We prepared a general code in MATLAB which you can use for your own simulation or optimization process. We will personalize the MATLAB code to be in accordance with our simulation. You can make a journal file and MATLAB by yourself to do your own simulation or optimization after watching this package. Now you can run the MATLAB code and report the desired outputs for your input variables. After that, we give you the NASA report plots which are ‘Angle of Attack’ vs. ‘Lift Coefficient’ and ‘Lift Coefficient’ vs. ‘Drag Coefficient’. Also, you can save the output parameters of each simulation and calculate the lift and drag coefficients and plot the chart by the simulation data, and compare with NASA data.
If you are looking for another example in Ansys fluent, check this out: Mixing tank simulation with Ansys fluent(2D and 3D)


Ivan –
After using this educational package for simulating airfoil profiles with different angles of attack in Ansys Fluent, I am completely satisfied and pleased. This package comprehensively and step-by-step covers all the important stages of this process.
First of all, the comprehensive explanations about the importance of airfoil profiles in various industries help me gain a deep understanding of the applications of these simulations. The key parameters such as lift and drag coefficients are also well explained.
Another important point is the connection of MATLAB to Ansys Fluent for automatic parameter adjustment, which provides the possibility of optimization. This feature is very useful and practical.
Experts Of CAE Assistant Group –
Very Nice!