
Are you interested in customizing the Abaqus interface? Are you looking to create comprehensive analysis reports? Would you like to alter the appearance of Abaqus results? Stay with the CAE assistant team in this practical post, where we delve into essential tasks within the Abaqus visualization and result modules. Gain valuable insights and discover how to efficiently capture Abaqus screenshots in the viewer.
1. Changing Fonts (Texts in results plot) in Abaqus visualization
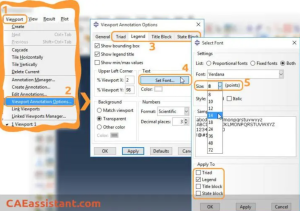
From the main menu bar select Viewport > Viewport Annotations Options:
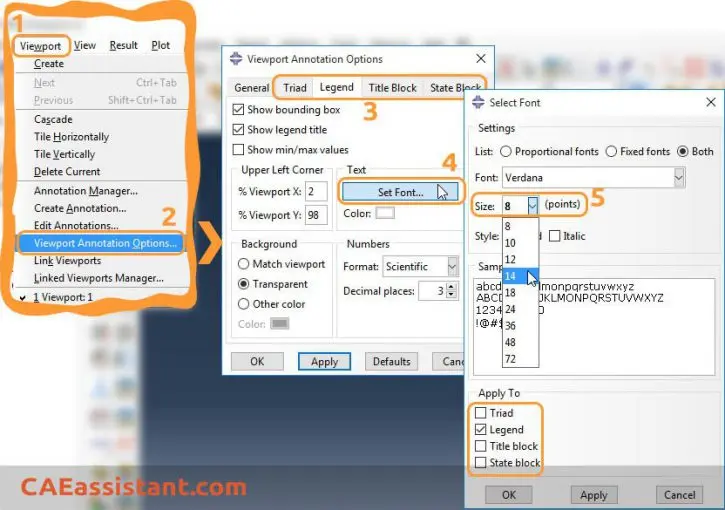
Go to the any of Legend, Title Block or State Block tabs. Now, click on the Set Font… button. In the Select Font form that appears you can set the size and type of font. The new size/type can be applied to the various categories:
1. Triad
2. Legend
3. Title Block
4. State Block
Tick the box you need.
You can also change the color of texts by selecting Color beneath the Set Font… button in Legend, Title Block or State Block tabs.

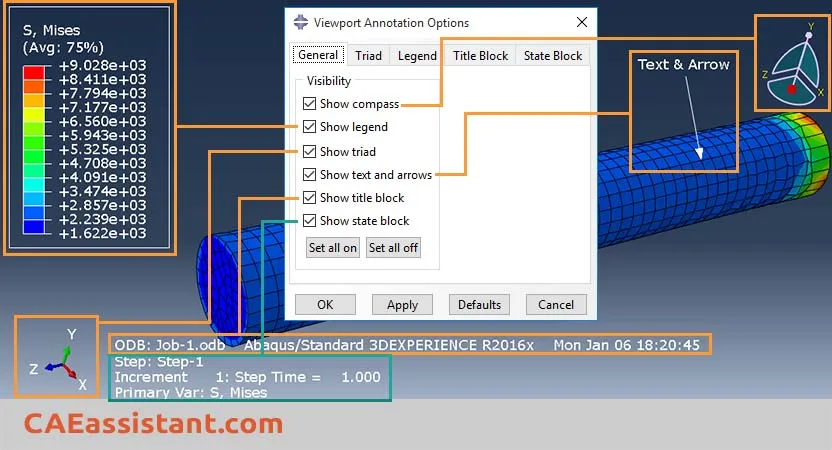
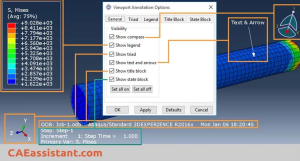
2. Showing items or not in Abaqus results
You can tell Abaqus whether to display different items in Abaqus results or not. From the main menu bar, select Viewport > Viewport Annotations. Then in General tab, check/uncheck items as favorable:
3. Modifying legend display in Abaqus visualization
In section 1 of the current article we have learned about modifying the font and color of the legend text. You can also make these other modifications to the Abaqus legend options:
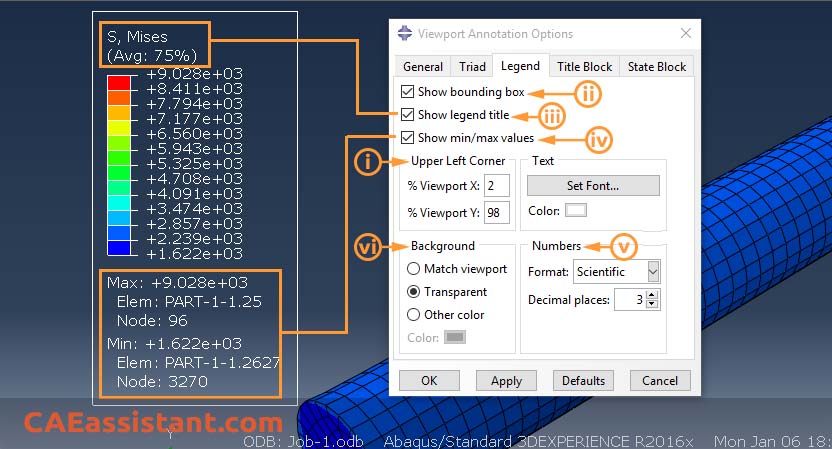
i) The position of the Abaqus legend (by changing the upper left corner (x,y) with respect to Viewport)
ii) Whether showing legend outlining the box or not
iii) Whether showing the legend title or not
iv) Showing Min/Max value in every frame with corresponding element and node No.
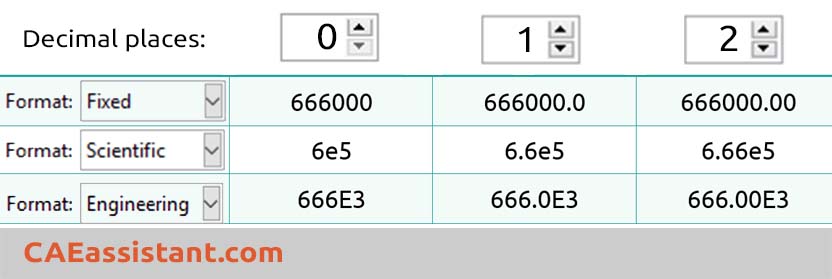
v) Format of the numbers in legend. Look at the table as a guide:
vi) Legend background
There are some more points about the Abaqus legend option that you can see in the next posts.
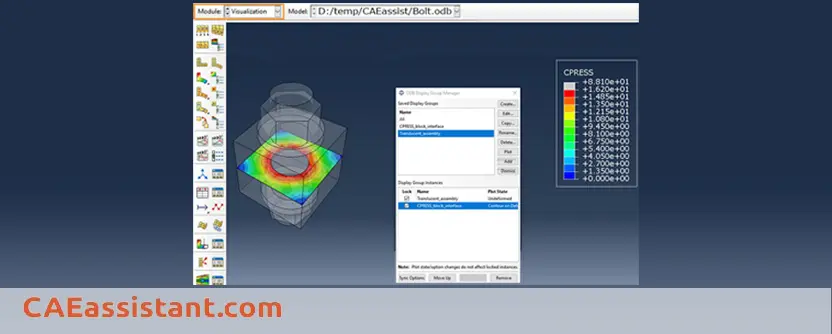
3.1. How do I display the location of the maximum and minimum values of stresses?
one of the common questions about this matter which our visitors ask us: I am looking for the position of maximum compression and tension stress. These values are reported on the rainbow spectrum in visualization module but I need to know the places of them.
The answer:
Click on the Contour Options icon, or you can find that in menu bar:
And in the dialog box which appears go to the Limits tab:
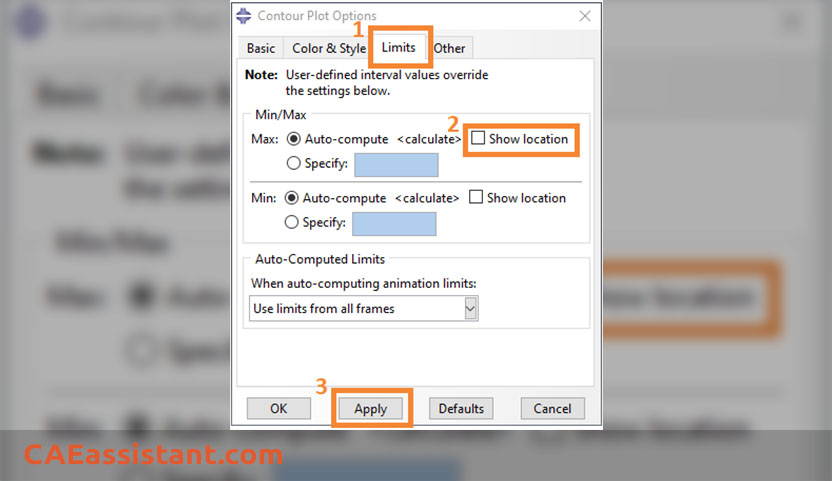
Check the boxes marked Show location for both/each of Max and Min values.
Click on Apply.
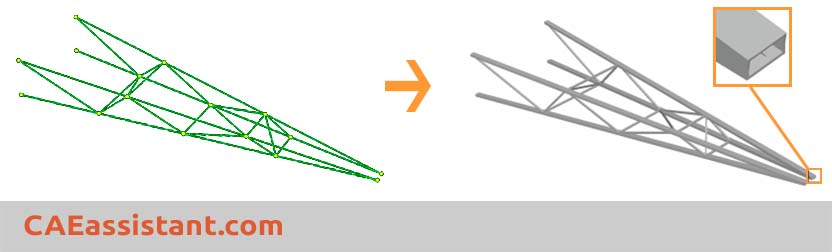
4. Displaying the beam profile and shell thickness
If you use wire parts to model beams, you can view an idealized representation (i.e. the 3D-shape) of the beam profile for Abaqus results data.
In the Visualization module, from the main menu bar, select View > ODB Display Options… (you can find that in left toolbox, too):
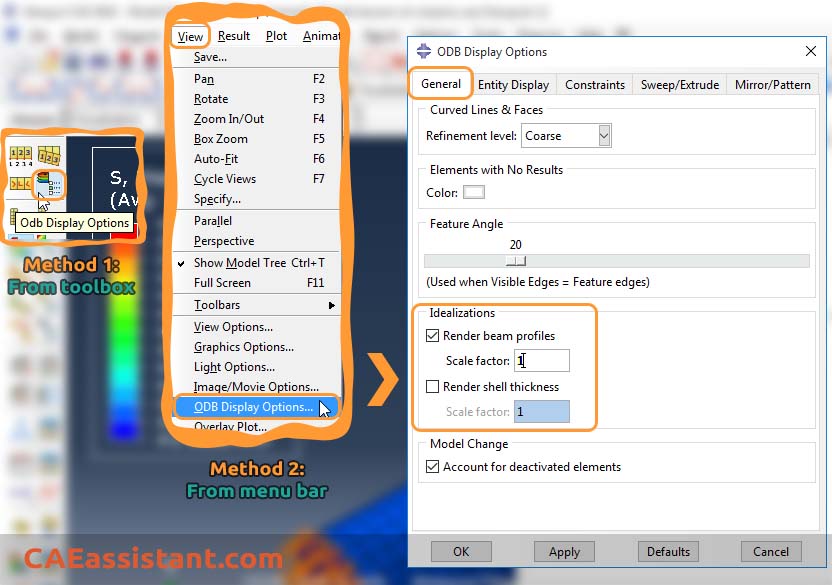
In the window appeared, on the first tab (General) there is a section called Idealizations. Check the Render beam profiles box. You can also choose the scale factor to increase the section size as you need.
In addition, you can visualize thickness for shell elements by checking the Render shell thickness box.
Beam and shell thickness rendering are available in the Visualization module for undeformed and deformed plots only. (Abaqus viewer )
Note: Did you know you could do the “Render Beam Profile” thing in the Assembly module as well?! Read the blog below to see how; Also, you can learn how to save your own graphical and view settings for later uses:
Save Abaqus Graphical Setting(s) in Abaqus/CAE | Abaqus Views Toolbar
 |
⭐⭐⭐ Abaqus Course | ⏰10 hours Video 👩🎓+1000 Students ♾️ Lifetime Access
✅ Module by Module Training ✅ Standard/Explicit Analyses Tutorial ✅ Subroutines (UMAT) Training … ✅ Python Scripting Lesson & Examples |
5. Display results on full model
Is that possible to display the results on a full model when we make use of the symmetry?
In the Visualization module, you can copy analysis results representing a repetitive portion of a model to visualize results for the entire model. To mirror results, you can select the coordinate system and up to three mirrors corresponding to the principal planes of the selected system:
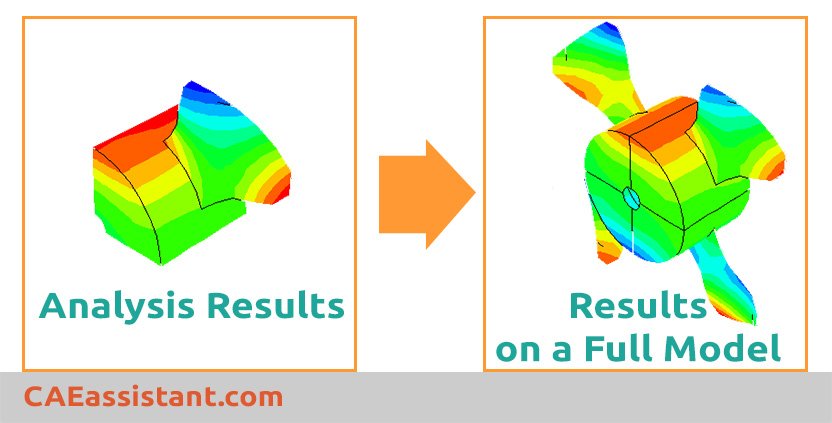
Mirrors are a visualization aid only. Any numerical representation of the results, such as the contour legend, indicates only the portion of the model that was analyzed.
In Visualization module, choose View > ODB Display Options…:
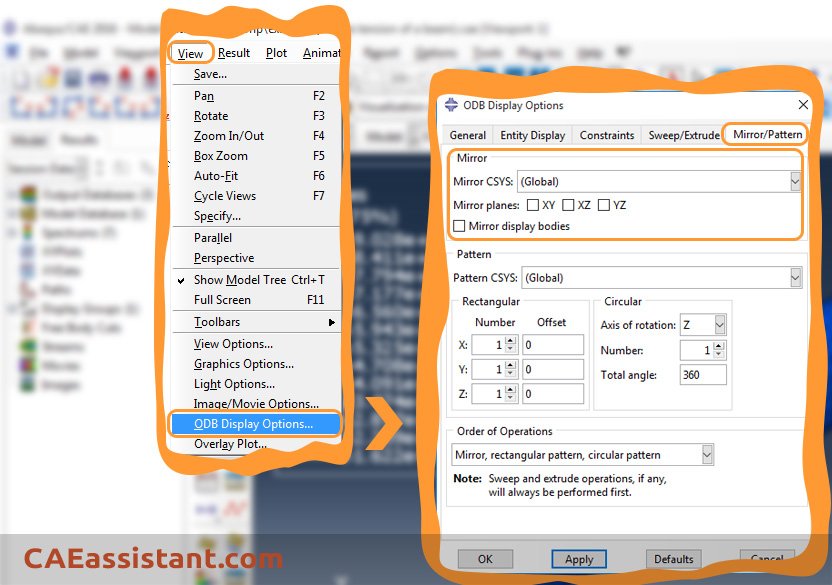
In the dialogue box, choose the Mirror/Pattern tab and tick the appropriate mirror planes. Then click on Apply.
The full model should be displayed.
6. Displaying boundary conditions (B.C.) in Abaqus results
In the Abaqus visualization module or Abaqus result module, you can show the boundary conditions of problem besides the result contours. From the main menu bar, select View > ODB Display Options…. In Entity Display tab, select Show boundary conditions:
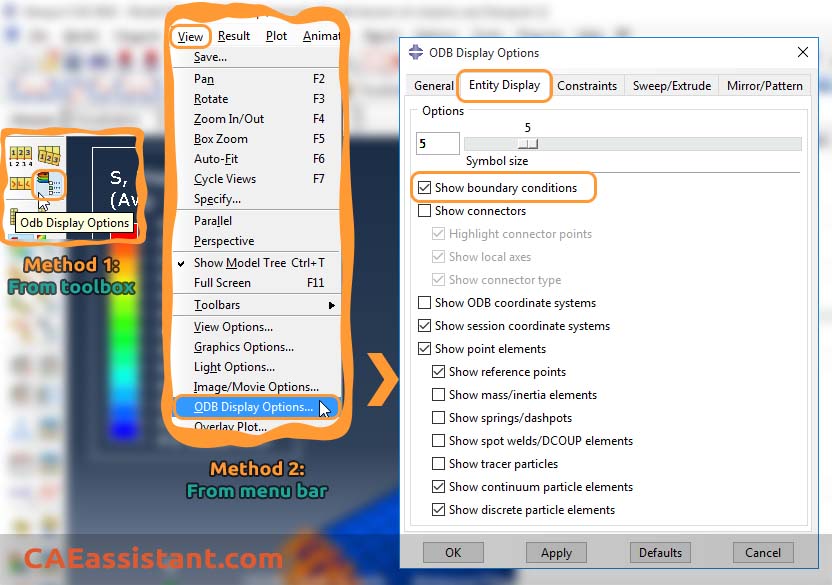
You can also decrease the size of the symbols if they are large and unsuitable or increase if required from Options section at the top.
Note: The display of model entities can affect Abaqus/CAE performance significantly and slowing down your computer.
7. Showing nodes and element labels
Element/node labels are numeric labels that identify each element/node in FEA.
To visualize the nodes and element labels within the Visualization module, from main menu bar select Options > Common… (or also Common Options from toolbox):
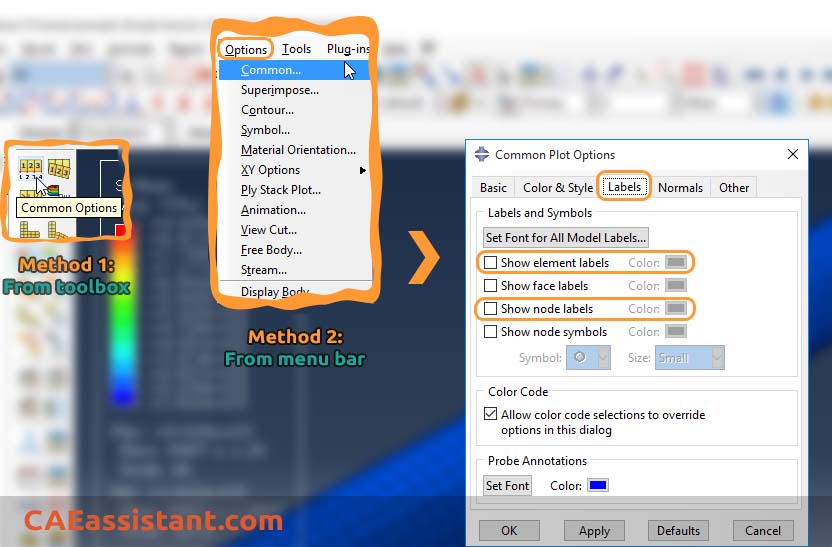 In the window appeared, go to Labels tab and tick Show element labels and/or Show node labels as required.
In addition, you can choose the Color of the element/nodes labels.
In the below video, I have summarized these tasks enjoy it and learn in a few minutes:
8. Changing Abaqus Background
When reporting your Abaqus results, the appearance of pictures you capture from Abaqus/CAE plots is affected by the difference in contrast between the model colors and the colors in the viewport background. You can improve this contrast by changing the color or colors displayed in the viewport background. You can display a single color or you can create a gradient background.
Especially when you need to print your contoured model or want to use it in a document, this is important to capture a high-quality picture, for example from your results in the Visualization module or your assembly or your meshed parts. To remove/change the default background color of Abaqus, follow these steps:
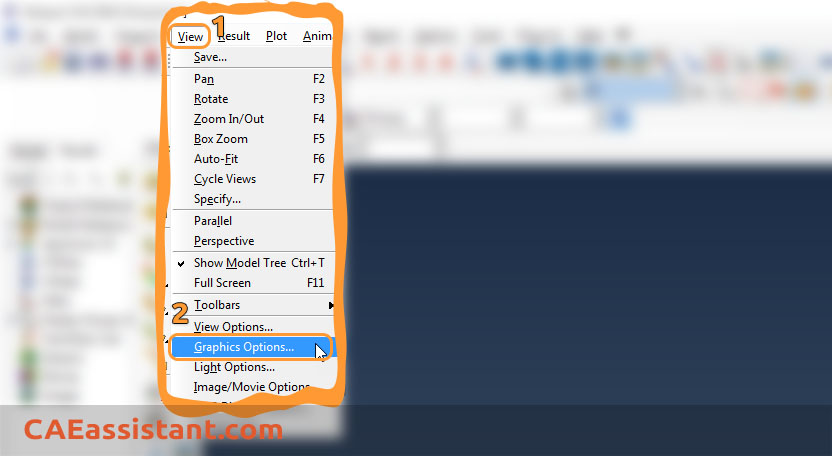
In any module, choose View > Graphics Options…:
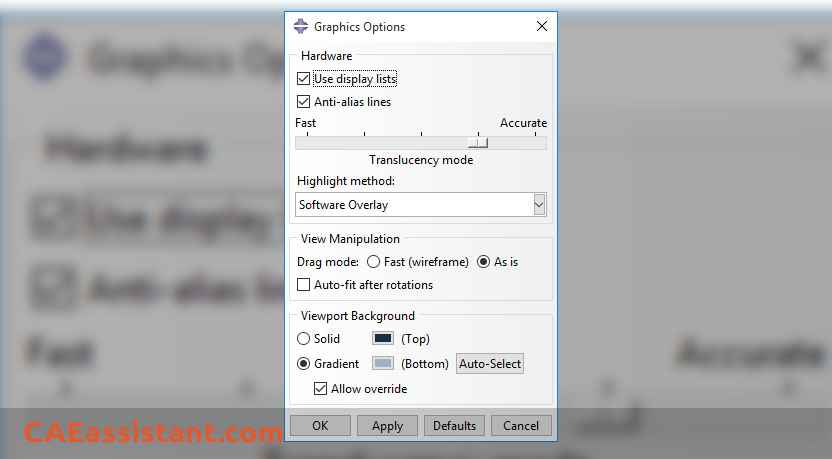
In the dialog box, notice the toggle buttons Solid and Gradient. Gradient will be active. Also, notice the colors marked (Top) and (Bottom). The default is Dark Blue at the top gradually changing to Silver Gray at the bottom.
To change the color to be uniform click on Solid and then click on the (Top) button and choose the color from color palette. Click OK in both dialog boxes:
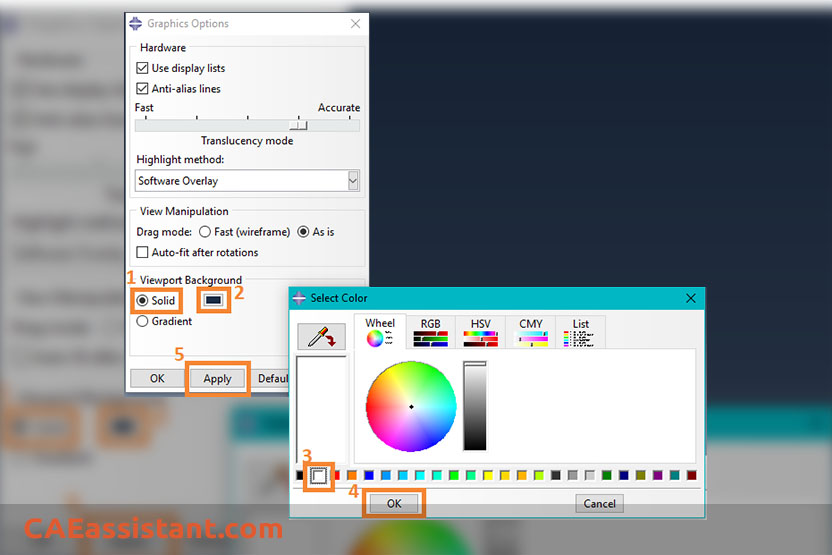
Here I select white as the background color, which is suitable when printing or using the picture of your model in presentations.
This is general and works in every module of Abaqus. Follow the instructions in the Visualization module.
It is recommended to select a solid white color.
|
⭐⭐⭐ Abaqus Course | ⏰10 hours Video 👩🎓+1000 Students ♾️ Lifetime Access
✅ Module by Module Training ✅ Standard/Explicit Analyses Tutorial ✅ Subroutines (UMAT) Training … ✅ Python Scripting Lesson & Examples |
9. Capture an image (Abaqus screenshot)
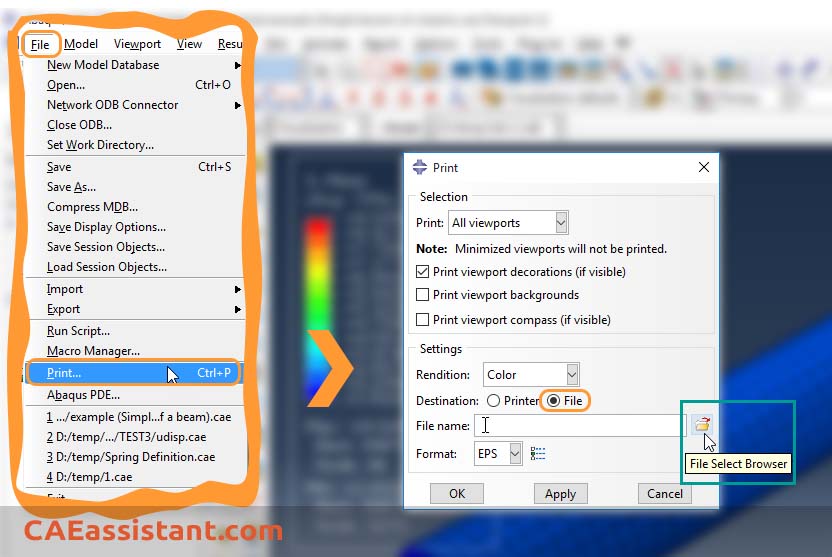
Abaqus/CAE allows you to take an Abaqus screenshot of viewports to a file for later use, for example, to include in a presentation or embed in a printed report. To capture an image, from the main menu bar in Abaqus viewer, select File > Print:
You can also use CTRL+P shortcut on your keyboard.
Now, select an image format such as PNG or TIFF and assign a File name to be saved in your working directory (as default). You can change the save directory by choosing the File Select Browser icon (look at the above picture).
If you want to have the most options when saving the Abaqus screenshot, you must select EPS format, which allows selecting image resolution besides its size.
As a simple trick, to get rid of these settings and Print window, just press CTRL+C on your keyboard to Capture an image. This will make a Copy of your current Viewport that can be Paste anywhere else (Word, Presentation, etc.). The function of this shortcut is exactly like Print Screen key (but is limited to the area of current Viewport in Abaqus/CAE).
If you prefer any of these customizations to be applied automatically for each time Abaqus opens, follow the instruction in:
Save Abaqus Graphical Setting(s) in Abaqus/CAE | Abaqus Views Toolbar
10. Exporting results to other software
Exporting Abaqus visualization results to other software can be achieved through various methods:
1. Export to Text Files (.rpt, .dat, .txt):
– Use the “Report > XY Data” option in the Visualization module to export data to a .rpt text file.
– Modify the input file to request output to a .dat file using the *NODE OUTPUT or *EL OUTPUT keywords.
– Use Python scripting to extract data from the output database (.odb) and write it to a text file.
2. Export to Excel:
– Use the “Plug-ins > Tools > Excel utilities” in the Visualization module to transfer XY data directly to an Excel file.
– Write Python scripts to extract data from the .odb file and export it to an Excel spreadsheet.
3. Export to ParaView:
– ParaView can directly read and visualize Abaqus output databases (.odb files), providing advanced visualization and data analysis capabilities.
4. Export to MATLAB/Python:
– Use the Abaqus Scripting Interface (ASI) in MATLAB or Python to access and extract data from the .odb file for further analysis and visualization.
5. Export to Third-Party Software:
– Some third-party software packages like HyperView, LS-PrePost, or Ensight can import Abaqus output databases (.odb files) for visualization and post-processing.
The choice of export method depends on the target software, data format requirements, and the level of customization needed. Text files and Excel provide a simple way to transfer data, while ParaView, MATLAB/Python, and third-party software offer more advanced visualization and analysis capabilities.
Get this post as a PDF file: cae assistant.com a-fast-guide-to-the-most-useful-tasks-in-abaqus-visualizat
Refrences:
[1] https://www.youtube.com/watch?v=adnWYQS1CS0
[2] https://www.youtube.com/watch?v=pymmvbp4Kz8
[3] https://www.eng-tips.com/viewthread.cfm?qid=303284
[4] https://www.sciencedirect.com/science/article/abs/pii/S0098300416306926
[5] https://www.researchgate.net/post/How-to-extract-results-for-analysis-in-abaqus-explicit
| ✅ Subscribed students | +80,000 |
| ✅ Upcoming courses | +300 |
| ✅ Tutorial hours | +300 |
| ✅ Tutorial packages | +100 |
How do I take an image from Abaqus?
To capture an image in Abaqus Viewer, follow these steps:
- From the main menu bar, select File > Print.
- In the opened window, specify the destination folder for the file.
- Provide a suitable name for the file.
- Choose an appropriate format for the image.
What is visualization in Abaqus?
Visualization in Abaqus is the graphical display of FEA simulation results. It allows you to see how your model behaves and identify areas of stress, strain, and deformation.
How do I change the font in Abaqus?
From the main menu bar, select Viewport > Viewport Annotations Options. Go to the Legend, Title Block, or State Block tab. Click the Set Font button. In the Select Font form, set the size and type of font.
How do you hide elements in Abaqus?
From the main menu bar, select Viewport > Viewport Annotations. Then in the General tab, check/uncheck items as favorable.
Thank you for being with us in this article. In order to always provide you with up-to-date and engaging content, we need to be familiar with your educational and professional experiences so that we can offer articles and lessons that are most useful to you.
This article was really useful for me. All the points I needed to prepare my report were told in this article. Is part B of this article printed now?